


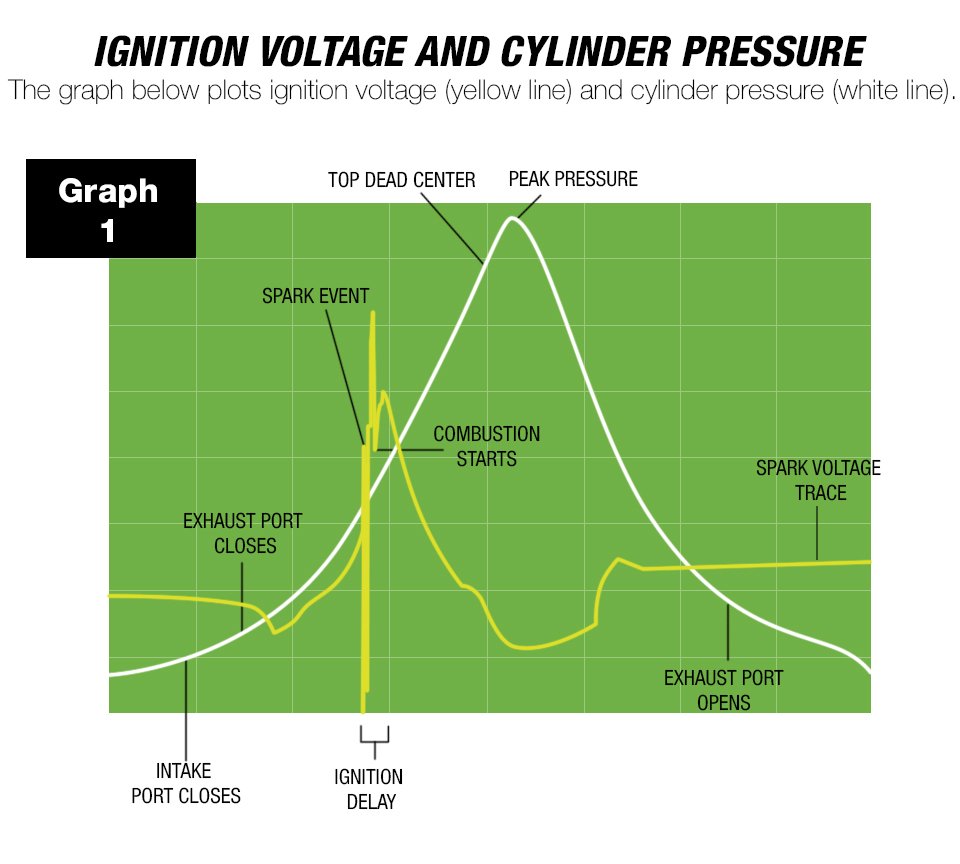
By measuring the pressure inside the cylinder while the engine is running, accurate details of the combustion process can be analyzed.
Graph 1 (below) plots ignition voltage (yellow line) and cylinder pressure (white line). The yellow line starts to rise as the piston moves upward (all valves closed) starting compression. At the right moment, usually around 28° before Top Dead Center (TDC), the ignition system sends voltage to the spark plug. There is a lag of a few milliseconds from the time the current is sent and when the spark actually starts combustion. This is called the ignition delay. Once combustion starts, the pressure rises rapidly and peaks after TDC. This puts maximum pressure on the piston when the connecting rod is at the best leverage angle to the crankshaft.
During the power stroke the combusted gases expand rapidly and push hard on the piston. At a certain point the exhaust valve opens and vents off the pressure in the cylinder, meaning that no more work is done on pushing the piston.
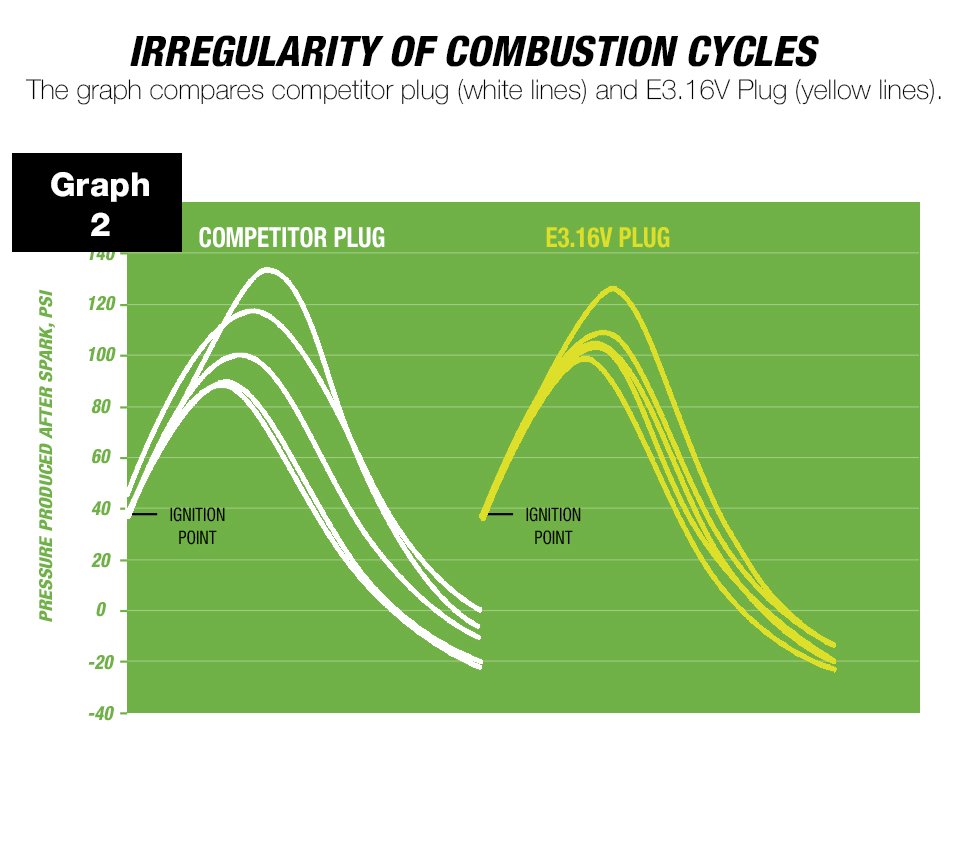
Graph 2 (below) a cylinder pressure graph reveals some interesting information. First, notice the peak pressure and area under the pressure curve as created by different spark plugs. All the power an engine makes comes from the area under this pressure curve. If a spark plug can create higher average pressure for every combustion cycle, it makes more power. Power improvements are shown on an engine dyno, but that measurement occurs late in the combustion process. The most accurate and sophisticated way to measure power is to look at the
cylinder pressure over a number of cycles (such as 500 cycles) and compare one modification to another. Since the flywheel integrates the cycles over time, and the individual pulses of each combustion event are lumped together, subtle improvements are hard to determine. For optimal tuning, major race teams from NASCAR to Formula 1 are now equipping their cars for in-cylinder pressure measurements. E3 engineers have been using this practice since the mid 1990s.
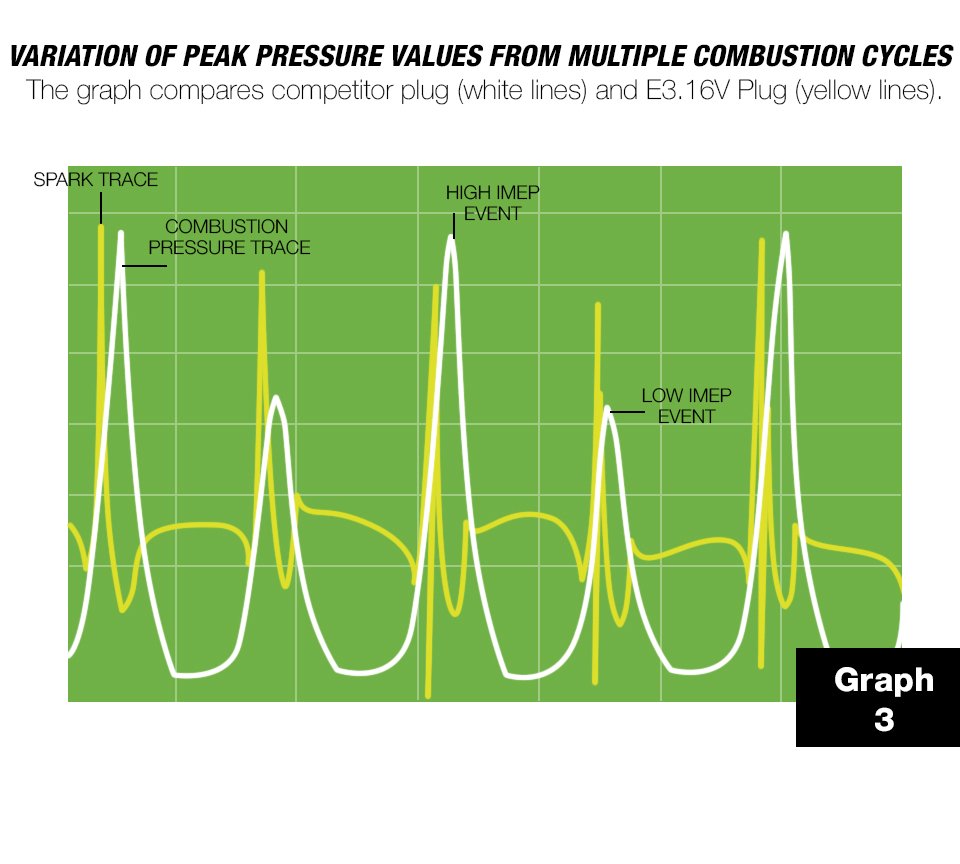
Graph 3 (below) shows how the E3 spark plug creates higher pressures in a test engine, compared to a standard spark plug. The higher and more consistent pressure levels directly result in more power and potentially less emissions, while burning more of the air-fuel mixture and requiring less throttle.
During the power stroke the combusted gases expand rapidly and push hard on the piston. At a pressure which leads to increased fuel economy. More fuel is converted to power, driving the piston downward more efficiently and less fuel escapes through the exhaust. Another important observation is the variation of peak pressure values from one combustion cycle to the next. Surprisingly, not all combustion cycles make the same power. An engine running well can still have a 5% drift in peak cylinder pressure values from one power stroke to another. A poorly running engine will have 10% or more. This is called the coefficient of variability.
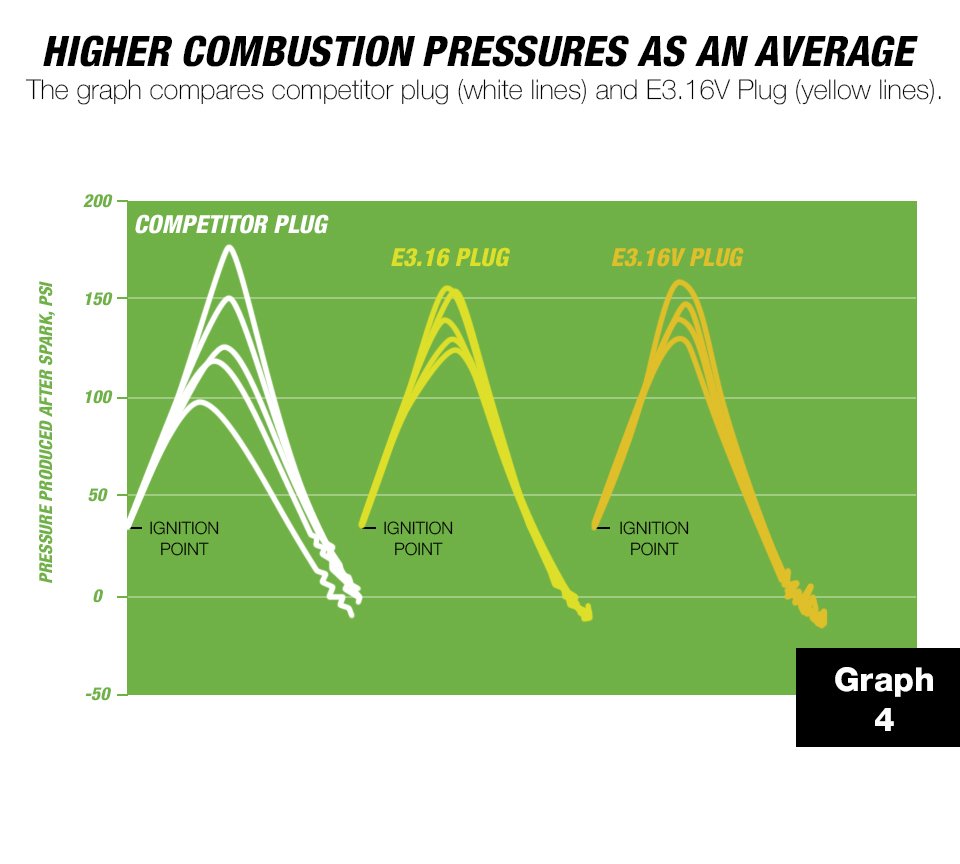
In Graph 4 (above), some combustion events result in high pressure production, others result in low pressure. The graph shows successive combustion events taken in real time, showing how cycles vary from one another even while the spark plug is firing very well. The comparison clearly shows that the E3 DiamondFIRE design produces more consistent and higher combustion pressures as an average over successive combustion events. This leads to more net power, and helps reduce emissions and improve fuel economy. Pressure traces of this sort show up in every engine we have tested since 1997.
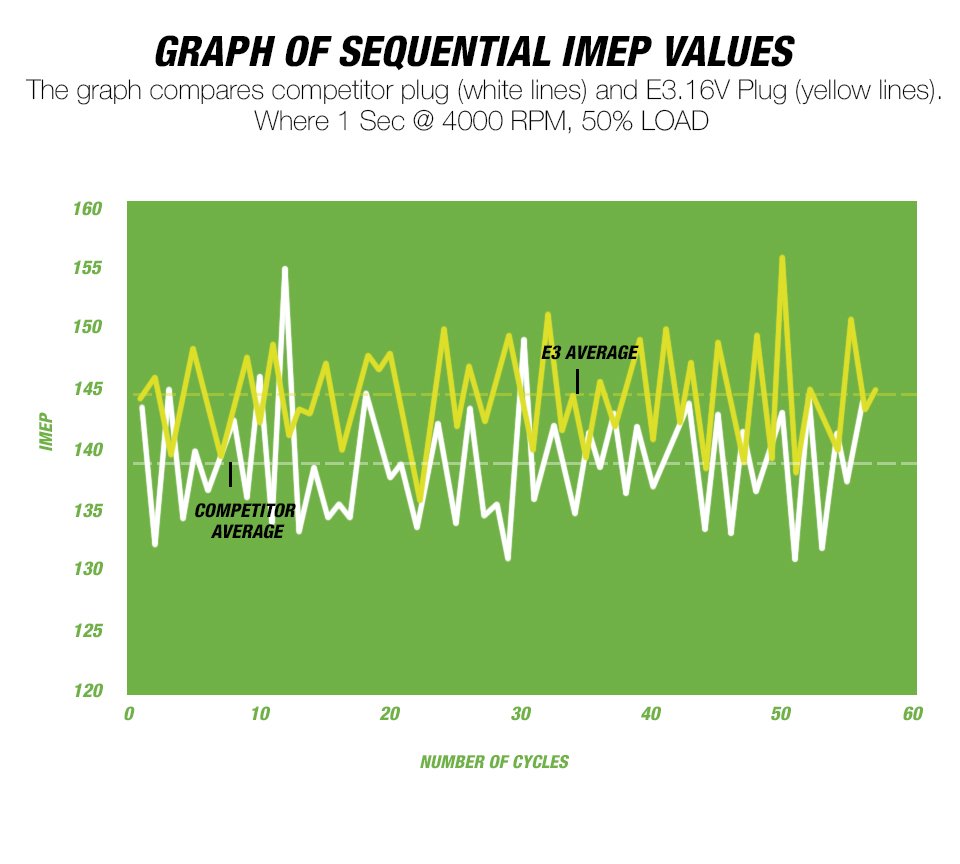
The Sequential IMEP Values graph (above) shows how E3 Spark Plugs improve pressures over a series of combustion cycles and how this adds up to better power. The yellow line was measured over a successive number of power cycles using E3 Spark Plugs. The pressure peaks are higher and more uniform than the standard spark plug (shown in the yellow line). The dotted lines represent an average of the pressure curves. The yellow dotted line shows the running average of the E3 Spark Plug pressure/power production. The dotted white line shows a lower average for the standard spark plug. E3 researchers have performed this type of analysis and measured consistent improvement in automotive engines, small two-stroke engines, and high performance four-stroke engines, etc. Creating a faster flame front and a quicker combustion pressure rise results in more complete combustion, and this directly improves engine performance.
Welcome to E3 Spark Plugs
home to the advanced DiamondFIRE spark plug technology